Winwick Wind Farm – Invertebrate sampling
As part of the post-construction monitoring of a new wind farm in Northamptonshire, Wild Frontier Ecology was commissioned to undertake invertebrate surveys.
The aims of the invertebrate monitoring were to help inform an assessment of the condition of the grassland field margins which are managed as part of the Habitat Improvement Plan for the site. The work schedule for monitoring prescribed terrestrial invertebrate sampling in years 1, 3, 6 and 9 following the construction of the wind farm, with surveys taking place in the second and third quarters of each year.
A CWAC trap deployed in the field
The survey strategy we developed involves the use of a combination of simple pitfall traps, swish netting and “CWAC” traps (devised by the University of Reading’s Centre for Wildlife Assessment and Conservation). This mix of trapping methods allows us to target a range of insects using the grassland habitat from ground dwellers such as some Coleoptera (beetles), Mollusca (slugs and snails) and Isopoda (woodlice etc), to more mobile climbing and hopping species such as Hemiptera (true bugs) and Hymenoptera (ants) as well as low-flying species including examples of Diptera (flies) and Lepidoptera (butterflies and moths).
We weren’t expecting there to be any rare species on the site, as it is intensively farmed; it was more important to get an idea of species composition and abundance suitable for comparison over time. Therefore the most efficient way of analysing the samples collected was considered to be by DNA analysis using metabarcoding techniques, undertaken by NatureMetrics, a company specialising in genetic analysis for the monitoring of biodiversity.
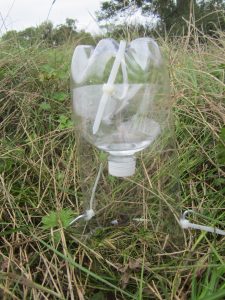
CWAC traps are made from plastic two litre bottles. The top end is cut off approximately one third of the way down and inserted into the upside-down body of the bottle, with small windows cut out of the sides. A window is cut out at the bottom of the trap to allow entry to low-flying insects. They tend to fly into the top of the bottle and become trapped, falling into a reservoir of preservative fluid. The trap is secured in place by two tent pegs and re-usable zip-ties.
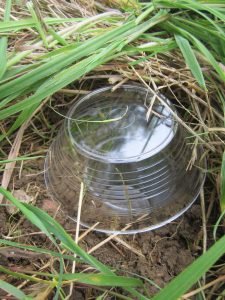
A deployed pitfall trap
The pitfall traps are simple yet effective. Small pits were dug into the ground (which at this particular wind farm was no mean feat when the heavy clay soil had become sun-baked) and plastic cups inserted, with the rim of the cup flush with the surface of the soil. A small amount of preservative fluid is poured into the cup (filling it to about a third) and a plastic lid is placed loosely over this in order to prevent the cup filling up with rain.
Five survey locations were identified in order to cover variations in the grassland habitat. At each survey point a single CWAC trap was deployed, with three pitfall traps placed one metre from this in a triangle formation. The pitfall traps were marked with canes for ease of re-finding upon collection.
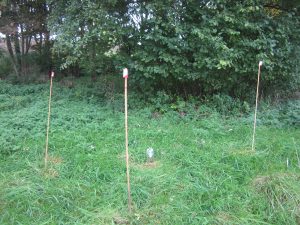
A set of traps at one of the sampling locations
The killing/preservative fluid used in the traps during the first trap deployment in June was a soapy solution, which although an effective killing fluid turned out not to be a particularly successful preservative. Although there was some concern that the quality of the DNA would be compromised because of this, the laboratory analysis by NatureMetrics turned out good quality and informative data. In the second sampling effort of the year (September) we switched to using an ethanol solution, which was a vast improvement, giving a better quality sample that was much gentler on the olfactory system!
The analysis by NatureMetrics used their “invertebrate identification from bulk sample” pipeline. This involves grinding up the entire contents of each trap sample, extracting the DNA from the resulting ‘invertebrate soup’ and then sequencing it. Each sample produces many thousands of DNA sequences, which are compared against an online reference library to assign taxonomy. The majority of taxa (over 80%) could be identified to species, and the remainder were assigned at the genus or family level. Overall NatureMetrics identified 144 unique taxa within our samples, 123 of which they were able to identify to species level.
The results produced were well presented and easy to interpret. They will be straightforward to compare with the results of subsequent years of sampling. The summary of results presented at the start of the NatureMetrics report gives a concise synopsis of key findings. The graph in this section (examples below) is a great way to visually express the composition of each sample, making it easy to compare samples within and between each sampling effort. The information in the report provided by NatureMetrics is in many ways ideal for a site such as this, where we are not expecting the occurrence of any particularly rare or interesting species (which might require specialist search methods) but are more interested in any changes in species composition and abundance.
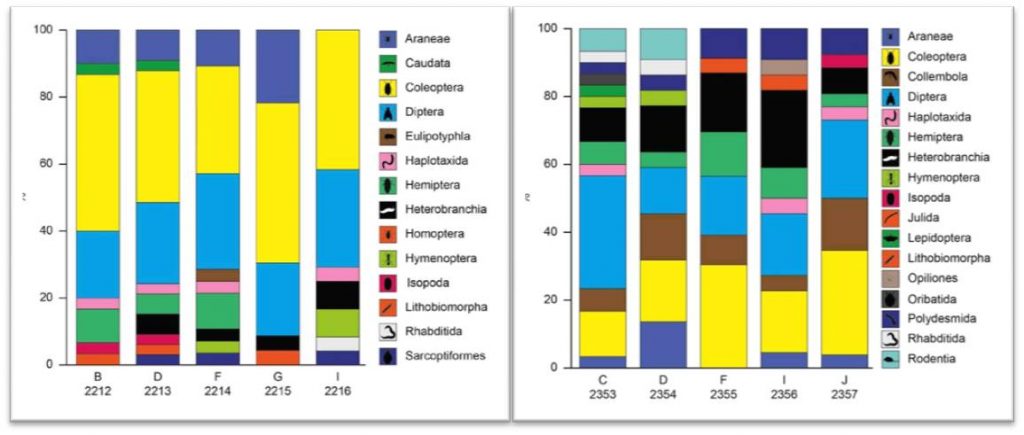
Examples of the summary graphs produced by NatureMetrics in their reports
The differences in the composition of samples collected between months is immediately apparent, with Diptera (flies) and Coleoptera (beetles) remaining the dominant taxa in both months but Heterobranchia (namely slugs) and Collembola (springtails) becoming much more abundant in September compared with June. It will be very interesting to see how our results compare in following years, with NatureMetrics results allowing us to easily detect changes in the invertebrate communities of the grassland margins of this wind farm.
-Mary